

Signal65 PINNACLE: Measuring Correct Work
A Methodology for Benchmarking Agentic AI in the Enterprise
Author

1. Executive Summary
Enterprises are deploying agents that run for 30 to 80 tool use rounds, read policy documents, apply governing rules, query databases, and produce a set of deliverables that someone downstream depends on. The metrics available to evaluate those deployments each answer half the question. Capability leaderboards measure whether a model can answer questions. Infrastructure benchmarks measure how many tokens a platform can move. Neither tells a buyer whether the work came out right.
Signal65 PINNACLE measures correct work. It runs multi step enterprise jobs inside environments generated fresh for every run, grades the result in code against a generated answer key at the moment the environment was built, and reports quality and capacity as separate numbers that a reader can interpret independently and recombine deliberately.
1.1 What the method does differently
1.2 The headline numbers
Two figures carry the headline. The PINNACLE Model Score reports quality, as a persona weighted composite of separately measured capabilities indexed so the reference model scores 1000. PINNACLE Intelligence Throughput reports productivity, combining that quality score with sustained platform speed weighted three to one, and compounding per task success across workflow depth.
Everything underneath both is published as well. Tasks per hour, agents sustained at service level, token efficiency, fabrication rate, cost per correct task, and the utilization point where owning infrastructure becomes cheaper than renting it. Any reader who rejects the weighting can rebuild either headline from the parts.
1.3 What it is not for
Signal65 PINNACLE measures the work enterprises are actually deploying agents to do. That focus is the source of its value, because whether an agent finishes a real job correctly on real data is the measurement that decides whether an agentic program returns anything at all, and it is the measurement the industry has least of.
It is not built to rank depth of world knowledge, craft of prose, or progress toward General Artificial Intelligence. Other benchmarks attempt to answer those questions and a buyer with those questions should use them. One consequence follows and is worth knowing in advance. Rankings here will not match rankings elsewhere, and a smaller model can lead this table while sitting well down a general capability leaderboard. Section 2.5 sets out the boundary in full.
1.4 The finding this method makes available
Every job in the suite is run in two different enterprise conditions, sampled many times in each. Governed data means an estate already organized, classified, and documented. As-found data means duplicated records, half finished migrations, naming conventions that changed twice, and rules that contradict each other. The result that does not exist anywhere else is the difference between those two scores. A model can hold up on organized data and fall apart on the same job when the data is messy. That gap is a per model property, it is wide, and it maps directly onto a procurement decision.
One measurement set, read three ways. The lenses share an origin, which is what makes cost per correct task a measured quantity rather than a modelled one.
2. The Measurement Gap
Two families of numbers dominate how agentic AI gets evaluated today. Both are legitimate. Both are carefully produced. Neither was built to answer the question an enterprise is actually asking, and the enterprise is left doing the translation itself.
2.1 What capability leaderboards measure
Capability leaderboards measure whether a model can produce a correct answer to a question posed in isolation. They are useful for tracking the frontier and they are the reason anyone can compare model families at all. Three properties limit what they can say about a deployment.
They are static, which means a fixed question set exists in the world and eventually finds its way into training data. Contamination is not hypothetical. When Microsoft Research rebuilt a widely used academic benchmark on contamination free lines, a leading proprietary model scored 73.4% against 88.0% on the original, a gap of 14.6 points between what a model remembers and what it can do. Zhao et al., MMLU-CF, arXiv 2412.15194.
They are single shot, which means they measure the answer rather than the work. An enterprise job is not one question. It is thirty to eighty rounds of reading, tool use, revision, and output, where an error in round nine propagates silently into every deliverable after it and the model never sees the correction.
And they are graded by judgment, either a human panel or another model. Judgment introduces a rater that has to be trusted, calibrated, and paid for, and the agreement rates published by the benchmarks that use it are lower than most readers assume.
2.2 What infrastructure benchmarks measure
Infrastructure benchmarks measure how much a serving stack can move. Throughput, interactivity, time to first token, performance per dollar, tokens per watt. These are real engineering measurements and the discipline behind the best of them is genuine. They are also the correct instrument for the question they answer, which is how expensive it is to run a given amount of traffic.
A correctness dimension is absent from all of them, and it is absent for a structural reason rather than an oversight. A benchmark built on recorded sessions can measure throughput because throughput is observable in a replay. It cannot measure quality, because a recording contains what happened rather than what should have happened. There is no answer key inside a trace to check an output against. That argument is developed in full in chapter 16.
2.3 The translation problem
The question an enterprise is actually asking is narrow and concrete. Which model and hardware stack will run my workload correctly, at the volume I need, within my budget. Every benchmark hands that buyer a score and leaves them to work out what it means, and a buyer holding a capability rank and a throughput curve still has to answer three questions that neither number addresses.
The third question is where the translation breaks down completely. Cost per token is knowable from a serving benchmark. Cost per correct task requires a correctness measurement taken on the same runs, and if quality and throughput are measured by two different parties on two different workloads, no honest arithmetic connects them.
2.4 The three lenses
PINNACLE is organized around the three questions above rather than around the instruments that produce the numbers. The same measurement set is read through three lenses.
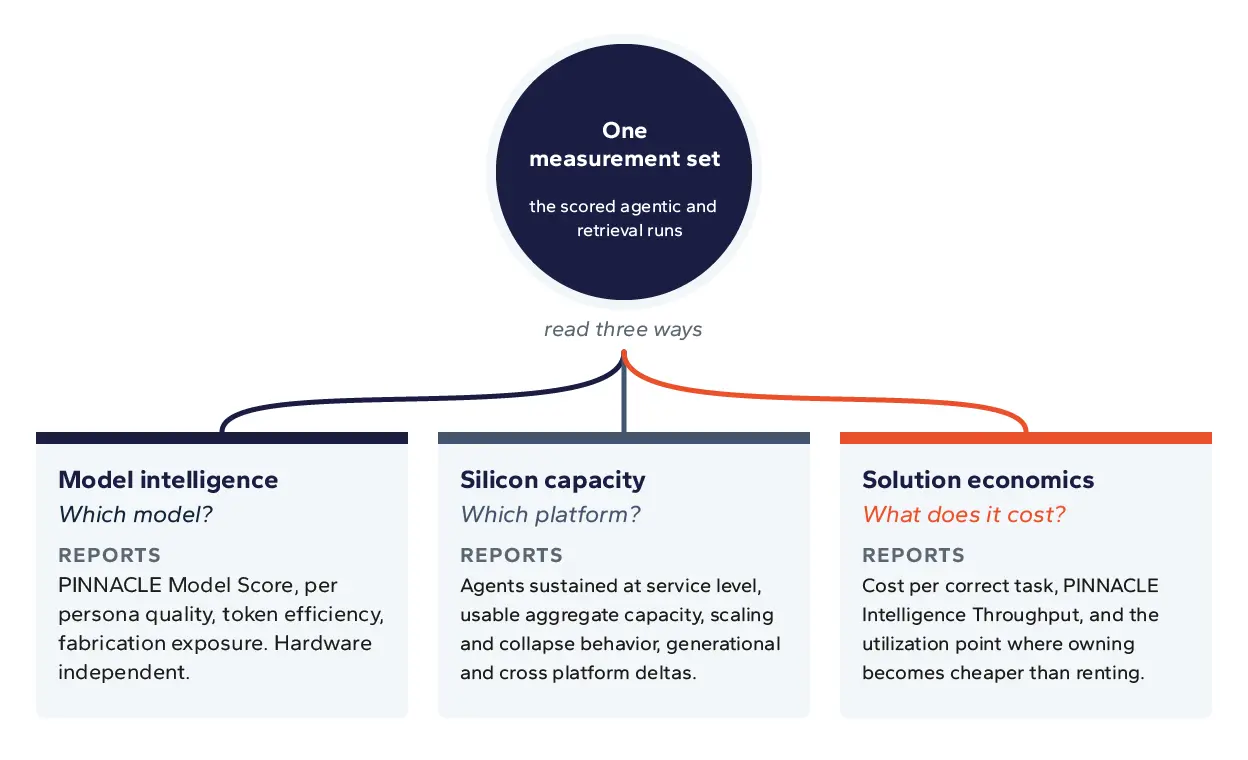
One measurement set, read three ways. The lenses share an origin, which is what makes cost per correct task a measured quantity rather than a modelled one.
2.5 What this benchmark does not measure
A score is only interpretable if a reader knows what question the instrument was built to answer. Signal65 PINNACLE was built to measure whether an agent completes enterprise work correctly, at what capacity, and at what cost per correct outcome. It was not built to track progress toward General Artificial Intelligence. That is a scope decision made at the outset.
Five things sit outside it.
The same argument runs through recent work from NVIDIA Research, Small Language Models are the Future of Agentic AI. Agentic systems put models to work performing a small number of specialized tasks repeatedly and with little variation, and for many of those invocations a small model is sufficiently capable and materially more economical, with systems calling several different models where broad conversational ability genuinely matters. An enterprise decomposing a workflow into orchestrated sub tasks does not need one model that is simultaneously the best physician, attorney, and physicist available. It needs each step done correctly, at a cost and a latency it can carry.
Where a buyer needs general conversational range or frontier reasoning, a general benchmark is the right instrument and this one is not. Where a buyer needs to know whether an agent finishes the job correctly against their data, at what concurrency, and at what cost per correct outcome, this is the instrument built for that question.
3. Foundations
Four published papers already specify most of what a reader needs in order to check the mechanics of the suite. Each is summarized below and linked in full.
3.1 The execution harness
PICARD is the harness underneath both component benchmarks. It generates the sandbox, creates the ground truth alongside it and holds it outside the sandbox, exposes the tool surface, and grades the result. The contamination resistance argument and the deterministic scoring path are specified in the published framework documentation, PICARD, Testing What Models Can Do, Not What They Have Seen, and are summarized rather than re-derived in chapter 5.
3.2 The agentic suite
KAMI is the agentic component. Two published rounds of results cover more than seventy models across open and proprietary families, round one on open models and round two on proprietary models. The formal specification and the full first round dataset are published separately, arXiv 2511.08042. The second round established a finding that motivates this entire program. Rank on traditional benchmarks predicts rank on agentic work poorly. Newer models within a family regularly scored below their predecessors on agentic tasks while scoring higher on conventional evaluations, which is what a field optimizing against the wrong instrument looks like from the outside.
3.3 The retrieval work
RIKER is the retrieval component. The published work defines grounding, aggregation, and fabrication resistance, measures each at 32K, 128K, and 200K context, and covers ninety one models at the shortest context length. Signal65 PINNACLE takes all three measures at 128K, for the reasons set out in section 10.2. Two findings from that work carry directly into this paper. Advertised context length is not a proxy for usable retrieval, and aggregation across documents degrades roughly twice as fast as single document extraction as context grows. The metric definitions used in chapter 10 are the published ones.
3.4 Why two component benchmarks rather than one
The two measure different faculties with non-overlapping failure modes, and enterprise work requires both. Almost every deployed agent both acts across many steps against a live tool surface and reasons over retrieved material it did not choose, so a model strong at one and weak at the other fails in production while looking competent on any benchmark that measures only its stronger half. The published retrieval data makes the point, since grounding and fabrication resistance turn out to be independent. The strongest single document retriever in the published roster at 128K context invents an answer on better than one unanswerable question in four, and no ranking built on retrieval accuracy would show it.
4. Design Principles
Four commitments were fixed before any implementation detail, and every architectural decision in the chapters that follow traces back to one of them.
4.1 Deterministic scoring
No model judges, no human raters, no scoring drift. Grading is code comparing an output against a ground truth value that the generator wrote before the agent started. This commitment is expensive in coverage rather than in money. Anything whose correctness is a matter of opinion falls outside the suite entirely, which rules out grading open ended prose and everything else that needs a judgment call, and chapter 19 sets out what that excludes. What it buys is a score that does not move when the grader is replaced, the reviewer changes, or the vendor disagrees. A result produced this way cannot be argued into a better number.
4.2 Contamination and optimization immunity by construction
Nothing is fixed, so there is nothing to train on and nothing to tune toward. Entities, values, file layouts, database contents, document text, and the distractors are all regenerated per run from a configuration space large enough that no two runs repeat. A model that trained on last week results gains nothing this week. This is a structural property of the generator rather than a promise about disclosure practices, which matters because the promise version has repeatedly failed in this field.
4.3 Occupational grounding
The work is defined by an external taxonomy rather than invented by the benchmark author. Task design follows the Generalized Work Activities published in the US Department of Labor occupational database, which means the answer to why these tasks and not others does not rest on Signal65 taste. Chapter 6 sets out exactly how much of that taxonomy is covered, how the covered set was chosen, and which parts are excluded and why.
4.4 Gradable live simulation
Agents run live against a real tool surface and choose their own path, and the answer key exists before the agent starts. Both halves matter. Live execution is what allows a model to take more rounds, recover from its own mistakes, or fail in a way a scripted replay would never surface. A generated answer key is what makes the outcome gradable at all. The design principle is not simulation for its own sake. It is that measuring correct work requires generating the work.
5. PICARD, the Execution Harness
PICARD builds the environment, generates the correct answer alongside it and holds it outside the agent sandbox, hands an agent a live tool surface, and verifies what comes back.
5.1 Sandbox generation and the configuration space
A scenario specification describes the shape of a job rather than an instance of it. At run time the harness instantiates that specification into a working sandbox. Entity names, numeric values, dates, directory structures, file counts, document bodies, database schemas and contents, and the specific distractors are all drawn per run.
A space that size is reachable because those draws are independent, so the dimensions multiply rather than add. No individual dimension has to be large. A few dozen independently drawn fields, each with a few thousand possible values, produces a space on the order of 10 to the 80th distinct instantiations without any one of them being remarkable.
The number that matters operationally is not the size of the space but the probability that any two runs land on the same instance. For a space of size N and r draws, that probability is approximately r squared over 2N. If every organization evaluating models ran a trillion scenarios between them, the chance that any two of those runs drew the same sandbox would sit below 10 to the negative 56th. Repetition is not unlikely in the ordinary sense. It does not occur.
Two things follow from that. Memorization has nothing to attach to, because the answer key for a given instance did not exist before that instance was generated, so a model cannot have encountered it during training regardless of what it trained on. And the object being estimated changes. A fixed test set yields a point score that can be overfit and that carries no sampling error, since running it again returns the same questions. Drawing from a distribution yields an estimate of expected performance across the scenario population, with a sampling error that is quantifiable and that narrows as samples accumulate. Overfitting is not merely discouraged in that setting. There is no fixed target to overfit against.
Two organizations running the same scenario specification on the same model will see the same score to within sampling variance, and neither will have seen the same sandbox. Reproducibility and non-repeatability are usually in tension. Generating from a specification gets both.
5.2 Ground truth generation
The correct answer is created at the same moment as the environment, by the same process, from the same draw. When the generator writes a database containing four hundred orders across three regions, it already holds the value that a correct regional revenue query returns, because it computed that value in order to write the rows. When it writes a policy handbook with a governing rule and then scatters records that the rule applies to, it holds the correct disposition of every record.
This is the inversion that makes deterministic grading possible. A conventional benchmark starts with documents and works backward to answers, which requires annotation and eventually requires judgment. Starting from the answer and generating the environment around it means the answer key is a byproduct of construction rather than a separate artifact that has to be produced and trusted.
5.3 Verification, and why no model appears in the grading path
Grading is code. A scoring type is attached to every deliverable and describes exactly what correct means for that artifact. File existence at a specified path. JSON key presence and value match. Numeric equality against a computed target. Structured content match against a generated reference. The grader reads the artifact the agent produced, applies the check, and returns a boolean.
No language model appears anywhere in that path, which removes an entire category of dispute. There is no rater agreement rate to report, no judge model version to disclose, and no drift when the judge is upgraded. It also removes a category of capability, since anything requiring qualitative assessment is out of scope by construction. Chapter 19 treats that as the limitation it is.
5.4 The tool surface and the round cap
An agent working a scenario has filesystem operations, Python execution, and SQL query access against the generated sandbox. It reads what it wants, in the order it wants, and decides for itself when the job is finished. Nothing constrains the path.
Sessions run against a cap of 100 tool use rounds. Observed usage on the current scenario set runs approximately 30 to 80 rounds per engagement, so the cap functions as a termination guard rather than as a binding constraint on well behaved runs. A session that hits the cap is scored on what it produced, which is normally a failure, and the round count is retained because a model that needs eighty rounds where another needs thirty is telling you something a pass or fail cannot.
5.5 Run to run variation
Because each run draws a fresh instance, individual runs vary. That variance is handled by sampling rather than by suppression. Every scenario is sampled 40 times per model, organized as 8 independent runs of 5 samples each. The split into 8 runs is a parallelization for compute efficiency and carries no methodological weight, since every sample regenerates its own environment from the specification and a sample drawn in one run is equivalent to a sample drawn in another.
Across the 7 scenarios in the suite that gives 280 scored samples per model. Those counts do not vary. Every model in every published result is measured on the identical sample count and the identical test suite, so no comparison in this paper rests on one model having been given more attempts than another.
Variance is also informative in its own right. A model whose score swings widely across draws of the same scenario is not equivalent to a model that scores the same mean consistently, and the two should not be presented as though they were. Where the spread is material it is reported alongside the mean.
6. Occupational Grounding
Every benchmark has to answer why these tasks and not others. Most answer it with taste. Signal65 PINNACLE answers it by inheritance.
6.1 The taxonomy
The US Department of Labor maintains an occupational database that decomposes work into a hierarchy. At the top sit 41 Generalized Work Activities, broad categories such as analyzing data, documenting information, and interacting with computers. Beneath them are Intermediate Work Activities, and beneath those, Detailed Work Activities that describe concrete acts performed on the job. Occupational analysts built and maintain that structure.
Task design starts from the Generalized Work Activities and reads downward through the detailed activities beneath them to understand what an activity actually consists of in practice. That reading is what a scenario is designed against.
6.2 The two gates
Two gates were applied to all 41, in order, on a plain reading of each activity and its detailed components.
Figure 1: The two selection gates.
The second gate is a statement about the instrument rather than about agents, and separating the two is the point of running them separately. An activity removed by gate two is one a current agent may well perform competently. The suite simply cannot prove it either way without introducing a judge, and introducing a judge would cost the property that makes every other number in this paper checkable.
6.3 The result
Twenty-six of the 41 Generalized Work Activities clear both gates and are modeled into the suite. That covered set is named the Signal65 Agent-Testable Work Activities. Within it, eighteen are exercised directly by scenario design and eight are exercised indirectly, appearing as accompanying work products that a scenario requires in order to be complete rather than as the object of the scenario itself.
Figure 2: Disposition of all 41 Generalized Work Activities. Measured against the published taxonomy, classified by Signal65.
6.4 What the excluded activities have in common
The fifteen excluded activities fall into three groups. Some need a physical body. Some need actual interpersonal standing, meaning a role conferred by other people rather than any act the agent performs, which is why a model can advise a chief executive and cannot be one. The rest are activities our current infrastructure cannot yet simulate and score.
Only the third group is waiting on engineering. The first two are not capability gaps that scale will close, which matters for anyone sizing agentic deployment against a workforce.
6.5 What the four unscoreable activities cost us
Four activities pass gate one and fail gate two. An agent can perform them. The outcome lives in how another person responds, which means there is no artifact to check against a generated answer key. Persuading, negotiating, resolving conflict, and providing consultation all have this shape, and their absence from the covered set is a limitation of the instrument that Signal65 chose to accept rather than paper over with a model judge.
A benchmark that reports only the activities it happens to cover well, and lets a reader infer that the rest were unimportant, has told a true set of facts and left a false impression.
7. Scenario Architecture
Every metric in this paper is computed over the artifact a scenario produces. What follows is a single job from generation through agent execution to grading.
7.1 Anatomy of a scenario
A scenario is not a question. It is a working session with four components.
7.2 Round and context profile
Scenarios run against a 100 round cap and accumulate substantial context as they go. Each round appends the prior exchange plus whatever the agent read, so a session that begins with a short instruction is operating over tens of thousands of tokens of accumulated state by the time it produces its final deliverable. This is what makes the workload agentic in the sense that matters for infrastructure. Context grows monotonically, prefix reuse is high, and the tail of the session is where both quality and serving behavior are decided.
7.3 One job, end to end
The specifics below are illustrative of a scenario shape rather than a transcript of a particular run.
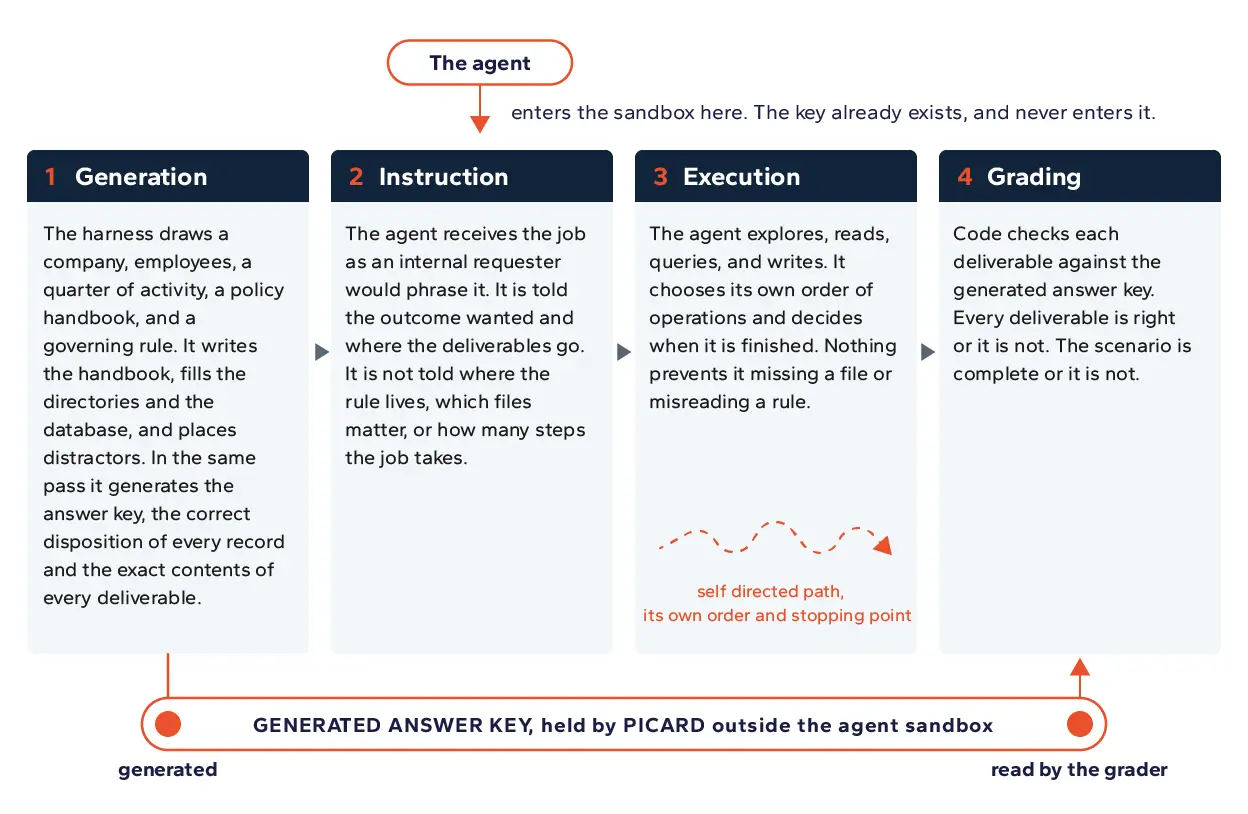
The answer key is generated with the environment and held by PICARD, outside the sandbox the agent works in. It exists before the agent sees anything, which is what makes deterministic grading possible.
7.4 The calibration loop
A scenario enters the suite only after it has survived a calibration pass in which traces are read rather than scores tallied. The pass asks one question about every failure. Did the model fail the job, or did the job fail the model. Calibration has caught cases of the second kind, where a strong model reached a defensible reading of a rule that the answer key did not encode. The correct response in that case is to rewrite the rule so that it admits one interpretation, not to adjust the key.
8. The Two Environments
Jobs run in two environments that differ in how much work the enterprise did before the agent arrived. This is not a difficulty dial and it should not be read as one. The two environments describe two real deployment shapes, and most readers will recognize immediately which one describes their own estate.
The suite holds 7 scenarios. Three run in the as-found environment, three are their governed counterparts, and one runs governed only, with no as-found version at present. The paired six are what the score gap in chapter 9 is computed from.
8.1 As-found
The as-found environment is data as an organization is likely to have accumulated it. Files that were migrated halfway and then abandoned. Two copies of the same record with different values and no indication of which is current. Naming conventions that changed twice. Directories organized by a scheme nobody documented. Records that appear to be in scope and are not, and records that do not appear to be in scope and are.
The governing rule still has to be applied correctly to all of it. The clutter is not decoration. It is constructed so that a plausible shortcut produces a wrong answer, which is exactly what happens in production when an agent is pointed at a real share drive.
8.2 Governed
The governed environment is the same job after the cleanup. Data is organized and classified. There is an explicit procedure. There is written guidance on how the agent is expected to behave. Ambiguity has been removed.
What has not been removed is the work. The governed scenarios run tens of tool use rounds, accumulate substantial context, and require the same multi step reasoning and the same complete set of correct deliverables. No reader should take the governed environment for a warm up, and the round counts and context figures are published precisely so that nobody does.
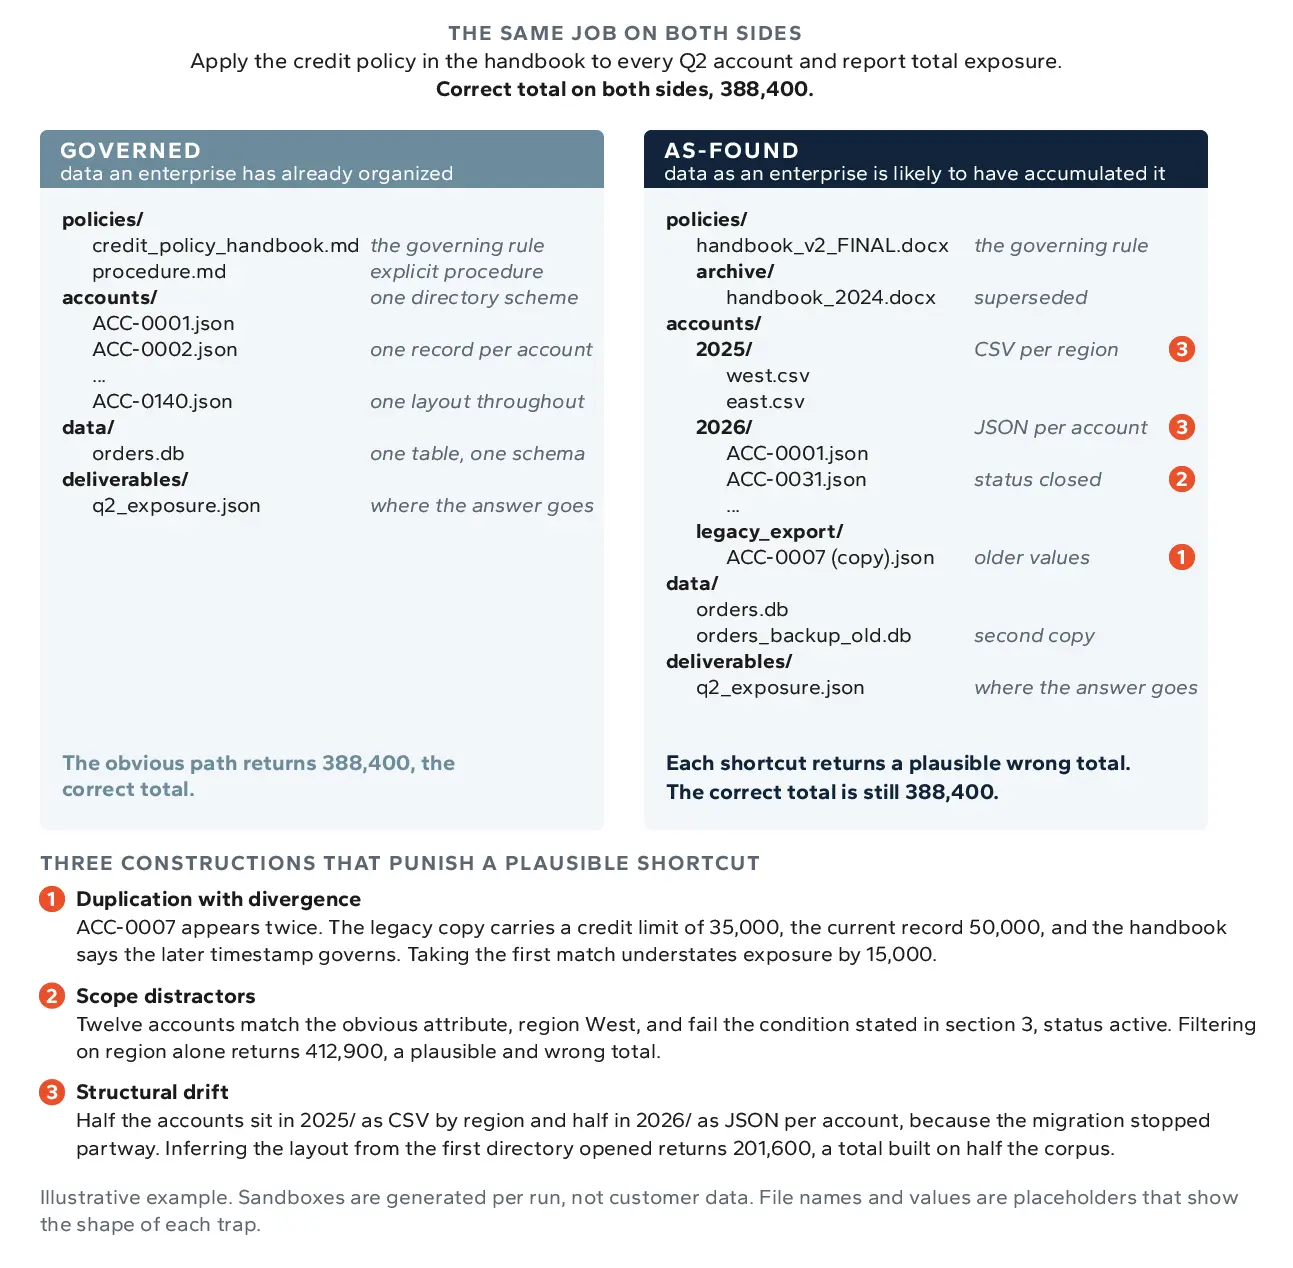
As-found is not harder data. It is data with specific structural pathologies, each of which turns a plausible shortcut into a specific wrong answer.
8.3 How a trap is built
Ambiguity in the as-found environment is generated rather than authored, which keeps it contamination resistant along with everything else. Three constructions do most of the work.
Fabrication traps run in both environments. Some questions have no supported answer, and the correct output states that the data does not support a conclusion. A model that produces a confident number instead has failed, and it has failed in the specific way that does the most damage in a deployed system.
8.4 How the two compose
Both environments contribute to the headline quality score. The as-found result carries 60% of the weight and the governed result carries 40%. As-found is the realistic case, and a score dominated by the governed environment would overstate what a buyer should expect on day one. Governed keeps substantial weight because a large share of enterprises are actively doing the cleanup, and for them the governed number describes where they are heading.
That weighting runs against the sample counts rather than with them. The three as-found scenarios contribute 120 samples per model and take 60% of the weight. The four governed scenarios contribute 160 samples and take 40%. The weighting is an editorial judgment about which condition matters more to a buyer, applied on top of the measurement rather than derived from it, and it is stated here so that nobody has to reverse engineer it from the scores.
9. The Gap Between Environments
The difference between a model score in the two environments is a very useful number, and it is not available from any other instrument, because no other instrument runs the same job against two deliberately constructed data conditions.
9.1 What the gap is
The gap is a per model property. Some models hold their score almost flat across the two environments. Others post a strong governed score and lose a large fraction of it when the same job is run against messy data. The spread across the roster is wide enough to reorder rankings depending on which environment a reader looks at, which is precisely why publishing only one of them would be misleading.
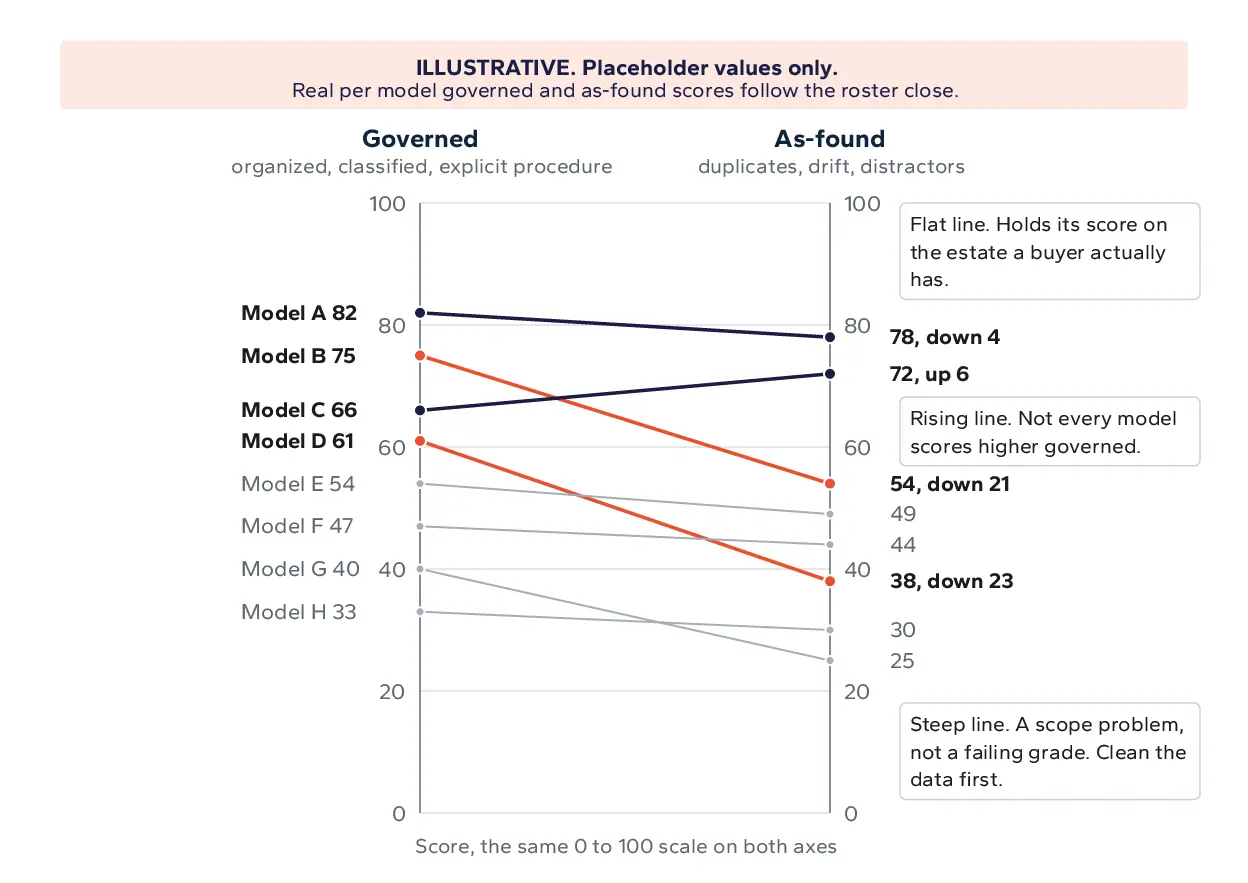
A model that holds its score from governed to as-found data can be trusted with the estate a buyer actually has. A steep drop is a scope problem, not a capability problem.
9.2 What it tells you about a model
A model that holds up in the governed environment and falls apart in the as-found one is telling you that it needs the data cleaned before it can be trusted with the job. It reasons correctly when the inputs are unambiguous and does not reliably detect ambiguity when it is present.
A model that scores poorly in both is a different case entirely. It is not failing to handle mess. It is failing to do the job.
A model with a large gap has a scope problem you can engineer around. A model that scores poorly under both has a capability problem you cannot.
9.3 The procurement decision it informs
An enterprise with organized and classified data, written agent rules, and bounded processes can safely deploy a model with a large gap, because it has already built the conditions that model needs. An enterprise pointing an agent at an estate as it accumulated cannot, and no amount of prompt engineering substitutes for the difference.
Read the other direction, the gap is also a budget argument. It converts data governance work from an act of hygiene into a quantity with a measured return, since the same model on the same job returns a different completion rate on either side of the cleanup.
9.4 How strongly the gap can be attributed
The governed scenarios are curated versions of the same underlying jobs as the as-found scenarios. Three as-found scenarios have governed counterparts built from the same specification, differing in the condition of the data and in nothing else.
That construction supports the strong reading. Because the job, the deliverables, the governing rule, and the answer key are identical on both sides, the difference between the two scores isolates the data condition rather than merely correlating with it. A model that drops twenty points crossing from governed to as-found dropped them to duplication, drift, and ambiguity, because there was nothing else to drop them to.
One scenario in the governed set has no as-found counterpart at present. It contributes to the governed score and to the headline, and it is excluded from the gap calculation, which is computed only across the paired scenarios.
10. Retrieval, Aggregation, and Fabrication Resistance
RIKER is the retrieval component of the suite. Documents are placed in context, no tools are available, and the model has to answer questions about what it was given. Three measures come out of it, and all three are defined in full in the published RIKER work.
10.1 The three measures
Figure 3: The three retrieval measures. Definitions are the published ones.
10.2 The retrieval context
All three measures are taken at 128K context. A single context length is used so that model comparisons hold one variable fixed and so that a persona score means the same thing for every model in the table.
The published retrieval work measured the same tasks at 32K, 128K, and 200K across ninety one models, and that work is what makes 128K the defensible choice rather than an arbitrary one. At 32K the field is compressed. Forty five of the ninety one models tested cleared 90% and twenty seven cleared 95%, which leaves too little separation to rank against. At 200K the roster thins out for a different reason, since only fifty four models were testable at that length at all and three cleared 95%, so the measurement increasingly describes which models can operate at that scale rather than how well they do the work. At 128K the field has separated enough to rank and the length still reflects a context that enterprises actually deploy.
10.3 Measuring fabrication requires generating the absence
Fabrication is the failure where a model produces a confident, specific, well formed answer to a question the source material does not answer. It is the failure enterprises ask about most and the one almost nobody quantifies, and the reason it goes unquantified is structural rather than a matter of effort.
To score fabrication, the grader has to know with certainty that the answer is absent. That certainty is only available to a party that built the corpus. A benchmark assembled from scraped documents, recorded sessions, or customer traces cannot certify that a fact appears nowhere in its material, because proving absence across a corpus nobody constructed is not something a benchmark can do. A model judge does not solve it either, since the judge has no more access to ground truth about absence than the model under test does.
Inverted generation solves it. The corpus is generated from a ground truth database rather than annotated after the fact, so the generator knows exactly which entities exist, which fields were populated, and which were deliberately left empty. Absence is generated with the same confidence as presence. Consistent entity relationships across the corpus are what make the guarantee hold at corpus scale, since an entity that is absent is absent everywhere and an omitted field is not quietly stated in a neighboring document.
Two probe types come out of that construction, and they correspond to two different real failures.
10.4 The fabrication rate
Fabrication resistance is measured as accuracy on those probes, and the leaderboard publishes its complement as a plain rate. A fabrication rate of 12% means that on 12 of every 100 questions whose answer was not present, the model produced one anyway.
Stating it as a rate matters because the number is not small and it is not evenly distributed. In the published work at 128K context, fabrication rates across the tested roster run from under 1% to more than 80%. No capability leaderboard reports that axis, and nothing else a buyer can consult would separate the two ends of it.
The more useful finding is that fabrication rate does not follow retrieval accuracy. A model can be excellent at finding facts and poor at admitting when there are none.
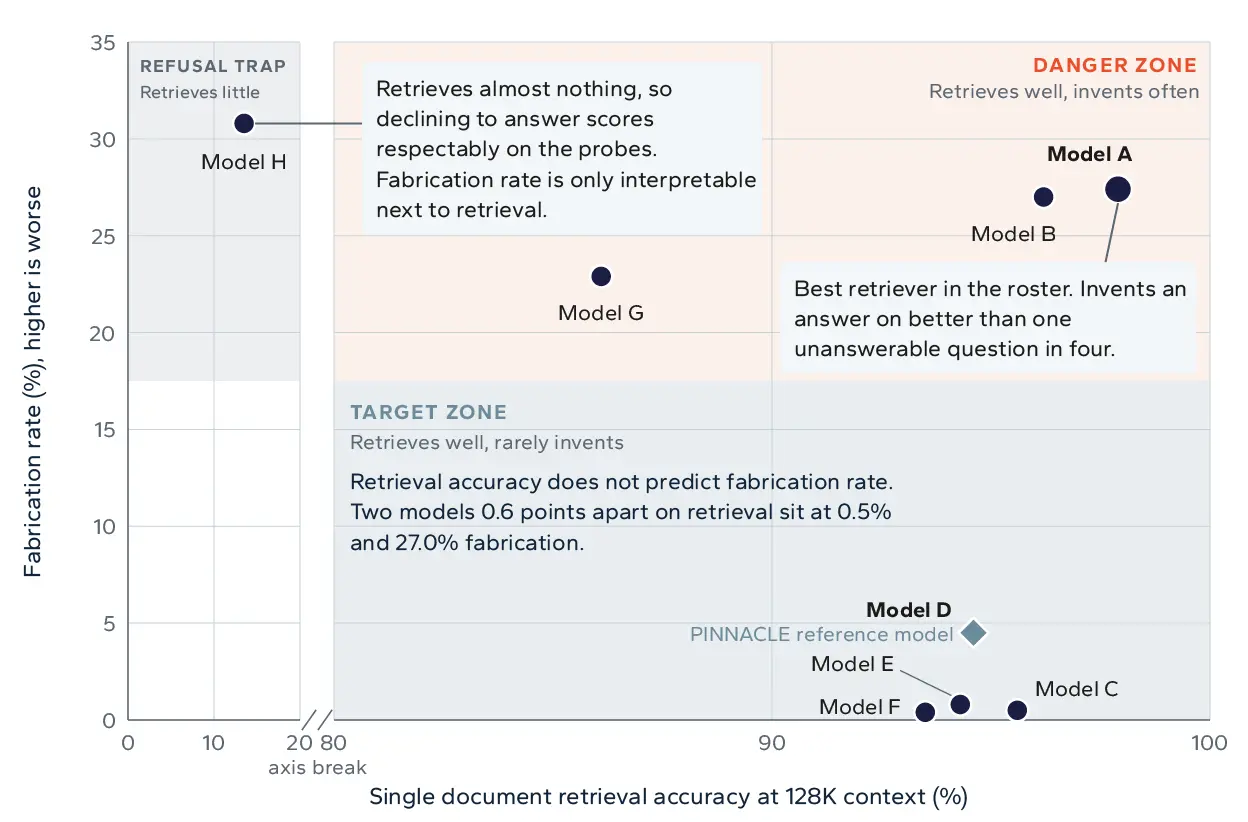
Retrieval accuracy does not predict fabrication rate. The best single document retriever in the roster at 128K invents an answer on better than one unanswerable question in four.
Model A is the finding. The model with the highest single document retrieval accuracy in the entire roster at this context length also fabricates on better than one in four unanswerable questions. A buyer selecting on retrieval accuracy alone would pick it, and would be selecting the most confidently wrong model available to them.
Model H is the trap running the other way, and it is the reason fabrication rate is never published on its own. A model that answers almost nothing scores respectably on probes designed to reward saying nothing. Read in isolation the number flatters it. Read next to a retrieval accuracy of 13.5% it is exposed as a model that is not answering rather than a model that is declining well. Fabrication rate and retrieval accuracy are only interpretable together, which is why both are published and neither is folded into the other.
Configuration moves this axis further than most readers expect. In the published data, enabling reasoning on one model family took the fabrication rate at 128K from above 80% to near 3% on the same weights, a larger swing than any change of model in the same size class. Reasoning configuration belongs in the deployment decision alongside the choice of model.
10.5 Why fabrication costs more than an empty answer
A retrieval miss and a fabrication are not the same failure and they do not cost the same to absorb.
A retrieval miss announces itself. The output says the information could not be found, a human follows up, and the process continues at the cost of a delay. A fabrication announces nothing. It produces a specific value in the expected format, in the expected place, indistinguishable from a correct answer to anyone who does not already know the correct answer. It flows into the next step of the workflow, into the deliverable, and into whatever decision the deliverable supports.
The asymmetry is in detection cost. Catching a fabrication requires going back to the source material and confirming the absence, which is the work the agent was deployed to remove. One invented value can therefore erase the savings from a large number of correct ones, and the deeper the workflow and the more autonomous the deployment, the worse the arithmetic gets.
This is why the Customer Operations persona weights fabrication resistance highest of any persona in the suite. An autonomous agent answering policy questions without a human in the path converts every fabrication directly into an exposure, and for that deployment a refusal is not a degraded answer but the correct one.
10.6 What the context work established
Two results from the published work carry into how the suite is read, beyond fixing the measurement at 128K.
Aggregation degrades roughly twice as fast as single document extraction as context grows. Across all models tested, aggregation accuracy fell by an average of 16.5% at 128K and 25.6% at 200K relative to 32K. Since most enterprise retrieval work is synthesis across sources rather than extraction from one page, the harder of the two measures is also the more representative one.
Fabrication resistance degrades more slowly than retrieval does. Probe accuracy fell by an average of 2.79% at 128K and 9.78% at 200K, materially less than either retrieval measure over the same range, and several models held flat or improved. Retrieval failure and fabrication are therefore partially distinct failure modes rather than two symptoms of one weakness, which is the measured basis for keeping them as separate capabilities in chapter 11 rather than combining them.
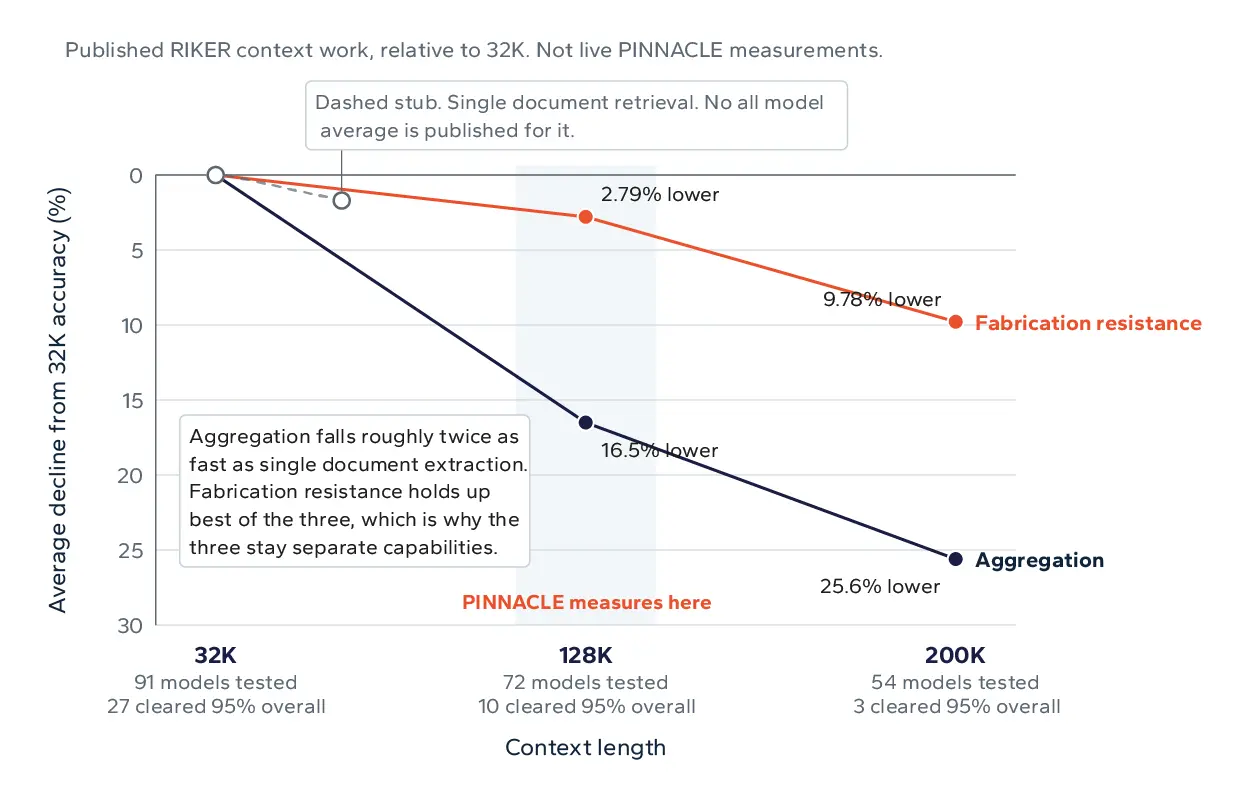
The three retrieval measures do not degrade at the same rate. Aggregation falls roughly twice as fast as single document extraction, and fabrication resistance holds up best.
11. The Enterprise Personas
A single aggregated score is useful and it is not sufficient on its own. Signal65 PINNACLE publishes one, because a buyer comparing a field of models needs a place to start, and the standing objection to any such score is that aggregation hides the thing a particular buyer actually cares about. That objection is fair. What makes it hard to answer is that nobody outside a benchmark can take a published score apart again, because nobody outside controls the structure underneath it.
The persona layer is the answer. It works because five genuinely different capabilities are measured separately and kept separate, so the aggregate can be rebuilt in whatever proportions a reader needs rather than being the only view on offer.
11.1 The five measured capabilities
Figure 4: The five separately measured inputs to every persona score.
11.2 The five roles
Each persona weights those five by what the role actually fails on. The weighting is not cosmetic. Because the five capabilities are empirically independent of one another, changing the proportions changes the answer, and the same roster of models produces materially different orderings depending on which role is asking.
Figure 5: The five personas and what each is weighted toward.
11.3 What the weighting changes
Reordering happens, and it is the point. A model that leads on aggregate quality can drop several places under the Customer Operations weighting if its fabrication resistance is weak, and a mid-ranked model with strong refusal behavior can lead that persona outright. On the published leaderboard this is exposed as a single control that re-ranks the table by persona, which converts a leaderboard into an answer to a specific buying question.
11.4 What the persona layer is and is not
The persona layer is a reweighting. Personas do not run distinct scenario suites, and all five read retrieval measured at a single context length of 128K. Every persona reads the same five measurements, taken under the same conditions, and recombines them in different proportions. No material anywhere should imply that a role runs its own tasks or its own retrieval conditions, because it does not.
The claim does not need it. A reweighting can be either a genuine analytical instrument or a cosmetic relabeling, and the difference between the two is testable.
A reweighting is cosmetic when the underlying measurements move together. If a model that is strong on one capability is reliably strong on all five, then any set of weights produces approximately the same ordering, the personas differ by a few decimal places, and the layer is decoration. That is the failure mode a skeptical reader should be checking for.
It is not what the measurements show. The five capabilities are substantially independent of one another, and two of those independences are large enough to reorder a leaderboard on their own.
Because those independences are real, the reweighting does real work. A model can lead the overall PINNACLE Model Score and rank several places lower under the Customer Operations weighting, and a model that never leads anything overall can lead a single persona outright. Those movements are not noise around a true ranking. They are the consequence of five measurements that genuinely disagree, and a buyer who only ever sees the aggregate never learns that they disagree.
Three properties let a reader check the layer instead of taking it on trust. The weights are published per persona, so a reader can recompute any persona score from the five underlying capability numbers. The capability numbers are published, so a reader who rejects the weights entirely can build their own. And the layer is falsifiable in the direction that matters, because if the personas were decoration the rankings would barely shift when the weights change.
A benchmark that aggregates before publishing cannot offer this at any weighting, because the information was destroyed at the point of aggregation. The argument rests on measuring separately rather than on running separate suites.
For a buyer the practical consequence is that the right table is rarely the default one. An enterprise deploying autonomous service agents and an enterprise deploying analyst copilots are not choosing between the same models, even though a single aggregate score would hand them the same ranking and the same recommendation. The persona layer is what lets one measurement set answer both questions honestly instead of answering one and approximating the other.
11.5 From personas to a workforce
Personas aggregate. An enterprise that knows roughly what share of its people work in each mode can combine the five into a company profile, and from there into token demand, sustained throughput, and infrastructure sizing. That extension is how the model quality layer connects to the capacity layer for a specific buyer rather than in the abstract.