
12. Scoring
Every agentic run is scored two ways, only one of the two enters the headline, and the composite is built from there.
12.1 Two scoring modes
Figure 6: The two scoring modes.
Every reader has met this as a grading policy. All or nothing per question against partial credit per question is a choice a teacher makes, and the two produce very different rankings over the same set of papers.
Partial credit earns its place because it measures potential rather than delivery. A model producing six correct deliverables out of seven has shipped nothing usable, and it has also demonstrated that it understood the job, located the governing rule, and executed most of it. That is a materially different proposition from a model that produced two of seven, and the difference describes what an integration team would be working with.
12.2 Why only workflow completion enters the headline
The headline PINNACLE Model Score is built from workflow completion in both environments. A deployed workflow that produces six of seven correct outputs has not shipped anything usable. Somebody still has to find the wrong one, and finding it requires redoing the work that was supposed to be delegated. Binary scoring is the view that matches what deployment requires.
Per-deliverable accuracy is measured and published alongside, never folded in. The distance between the two carries a great deal of the useful signal, which is the subject of the next section.
A run that produces seven deliverables and gets six right scores 0 on workflow completion and roughly 86% on per-deliverable accuracy. A run that gets three right scores 0 and roughly 43%. Under the headline, those two runs are identical, and under the companion measure they are not close. Both readings are true and they answer different questions.
12.3 The distance between the two modes
The gap between workflow completion and per-deliverable accuracy is an estimate of integration effort, and it is the second thing the de-aggregated structure makes available.
A model that completes few whole jobs while producing mostly correct individual deliverables is telling a buyer that the remaining distance is closable with engineering. Orchestration, validation steps, retry logic, and tighter prompting all attack exactly that gap, and a model in this position is a reasonable bet for a team willing to build around it. A model scoring poorly on both is telling them something else, because no scaffolding manufactures deliverables the model never got right.
Both numbers publish. Neither is folded into the other, and the distance between them is reported as a figure in its own right.
12.4 How the composite is built
Persona scores are a weighted geometric mean of the five measured capabilities using that persona weights. The overall PINNACLE Model Score is an unweighted geometric mean across the five personas.
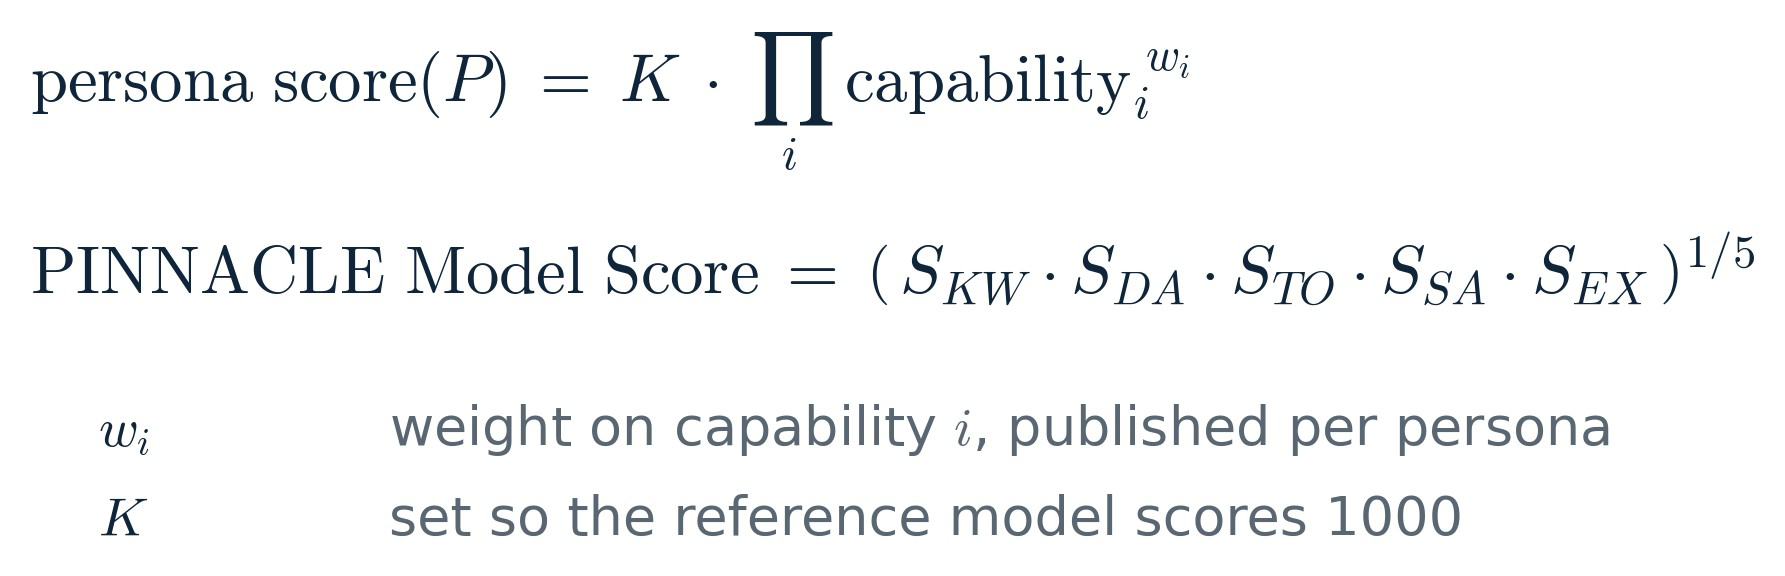
The geometric mean is the standard aggregation for composite benchmarks and it is used here for the same reasons it is used elsewhere. It treats percentage improvements symmetrically, it prevents one high scoring component from dominating, and it preserves relative rankings regardless of the reference chosen. Leaving the outer mean unweighted means a model has to be competent across all five personas, since catastrophic weakness in one cannot be bought back by excellence in another.
12.5 The reference model
K is set so that the reference model scores exactly 1000 on every persona and 1000 overall. The reference is Gemma-4-31B-it with thinking enabled, chosen on three grounds. It is a widely used open model with an established following. It comes from a major research lab rather than an obscure one. And during data collection it landed near the midpoint of the agentic score distribution, which puts the anchor in the middle of the field rather than at either end.
The last of those matters most for a scale. An anchor at the frontier compresses every other model into a narrow band below 1000, and an anchor at the bottom does the reverse. A midpoint anchor spreads the field in both directions and keeps 1000 meaningful as a reference point rather than as a ceiling.
The reference is held constant across releases within a major version. Moving it silently would invalidate every published comparison, so the conditions under which it moves are stated in the governance rules and prior results are restated rather than quietly replaced when it does.
12.6 Token efficiency
Token consumption is a property of the model rather than the hardware, and it is reported alongside the quality score rather than folded into it.
Two measures publish, because the plain reading and the useful reading are different numbers.
Output tokens per task. Median output tokens the model spends on one sample, regardless of whether it got the answer right. This is verbosity, and it is what most readers mean by token efficiency.
Output tokens per correct task. The first measure divided by the success rate. This is what a correct outcome actually costs, and it is the number that belongs in a budget.
The second is not a restatement of the first. Take two models that each spend 5,000 output tokens on a median sample, so their verbosity is identical. One succeeds every time and the other succeeds half the time. The first costs 5,000 output tokens per correct task. The second costs 10,000, because on average it takes two attempts worth of tokens to arrive at one correct result. Identical on the plain measure, twice the cost on the one that matters.
Hidden reasoning tokens count in both, because an enterprise pays for them in hosted and owned deployments alike.
Neither measure is folded into the quality score. A model that spends five times the tokens to reach the same score is a different proposition to deploy, and combining the two would make a score of 1150 ambiguous between accurate and efficient, and mediocre at both.
13. Performance Methodology
Speed in Signal65 PINNACLE is the usable capacity of a fully loaded platform, joined to the scored workload through a token recipe measured on the same runs. No published figure rests on a wall clock.
13.1 Full box saturation and the concurrency sweep
Speed is measured by loading a box rather than by timing one request. A saturation instrument sweeps concurrency, running N agents against the platform simultaneously and recording per agent decode rate, first token latency, and aggregate throughput at each rung.
The sweep does not stop when aggregate throughput peaks. It continues until a rung fails one of the two service level gates, and it stops as soon as either gate is breached rather than waiting for both. Past the aggregate peak a platform is less throughput efficient per agent, and it is frequently still serving every agent acceptably, so the concurrency it can carry can keep rising after the throughput it can deliver has begun to fall. Stopping at the peak would discard that range.
The search strategy is a coarse scan followed by refinement around each transition. Rungs are spaced widely, then narrowed to locate both the aggregate peak and the last rung that clears the gates. Every rung run is published, including the ones that failed and which gate each one failed on.
Single stream speed is deliberately not the measurement. One lucky fast request tells a buyer nothing about how many capable agents a platform can serve at once, and a productivity number that rewarded it would reward the wrong engineering. Loaded aggregate capacity rewards scalability, which single stream measurement cannot see at all.
13.2 Why no published figure rests on a wall clock
Any duration recorded in any trace is contaminated by the box it ran on, the load that box was under, the network in the path, and thermal state. Durations do not port between environments and they are not reproducible by a third party, which makes them unsuitable as the basis of a published comparison.
What survives is two portable quantities. A token recipe from the scored traces, which is what the intelligent behavior cost in tokens. And rates from the saturation instrument, which is how fast a platform emits tokens under load. These are multiplied at the end. A wall clock is never multiplied by anything.
13.3 The decode bound argument
Carrying a single rate is only legitimate if one phase dominates task time, and on this workload it does. Prefill runs approximately 500 times faster than decode, measured in our testing at roughly 19,000 tokens per second against roughly 40 tokens per second per agent on the largest models in the roster. Prefix reuse across rounds is high, which makes the prefill tail cheaper still.
So the portable number is decode aggregate throughput, applied to the completion token count from the scored trace. The naive alternative of dividing total tokens by one blended rate is wrong by construction, because prefill and decode differ by two orders of magnitude and growing context has to be charged on the uncached delta per round rather than on the full context every time.
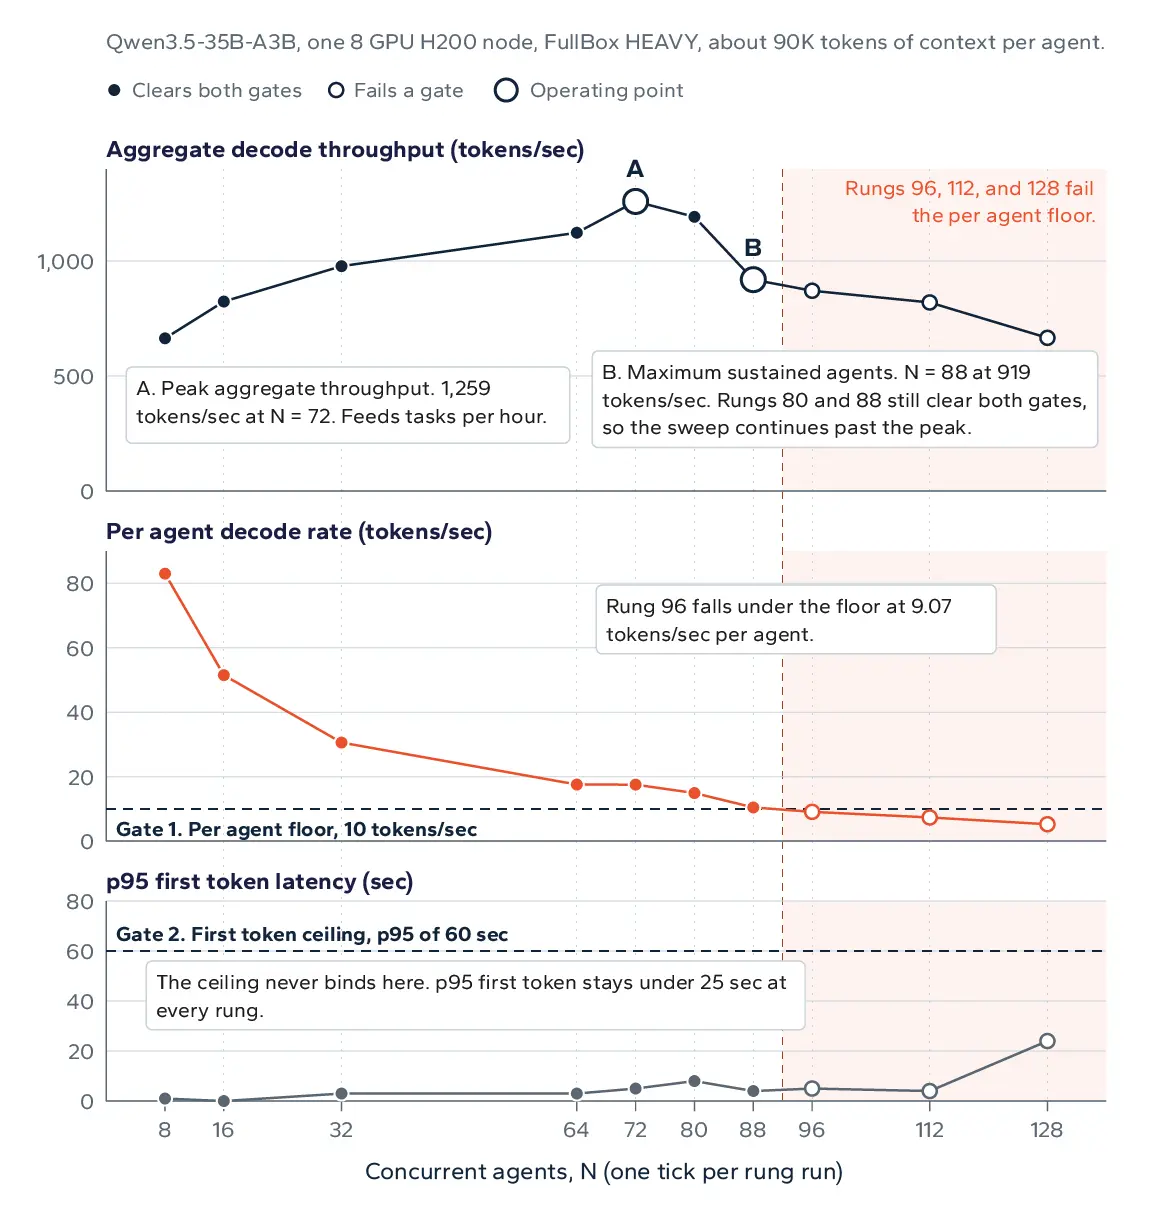
Capacity is not one number. The sweep continues past peak throughput, two operating points come out of it, and a rung counts only if it clears both service level gates.
13.4 The gates, and the two operating points
Raw peak aggregate is gameable. A platform can admit an enormous number of agents and slow every one of them to a crawl, and the aggregate number will look excellent while no agent is doing useful work. Two gates close that, and a rung has to clear both to count.
Figure 7: The two service level gates. A rung counts only if it clears both.
Two operating points come out of the sweep and both publish, because they answer different questions.
Figure 8: The two reported operating points. Where they diverge, the platform is trading per agent efficiency for headroom.
The first token ceiling exists for a reason that is only obvious after it has caught something. A stack under pressure can admit sessions into a queue and report healthy decode rates for the subset it is actively serving. Per agent decode is therefore not sufficient on its own. Measuring the latency to the first token across all admitted agents exposes the difference between agents being served and agents being held.
Sixty seconds is deliberately permissive. It is a liveness threshold rather than an interactivity one, because agentic work is dispatched and collected later rather than watched. Under normal operation the gate never binds, and it binds sharply once a stack begins queueing, which is exactly the behavior it exists to catch.
Signal65 Comment: Agent count is a capacity number and a quality of service axis, and it is reported on the silicon lens. It is deliberately not a term in the productivity composite, because concurrency cancels out of tasks per hour. At equal in service aggregate throughput, tasks per hour is identical however many agents share it.
13.5 The bridge to tasks per hour
The rate comes from the box and the token cost comes from the task. They are joined per token.
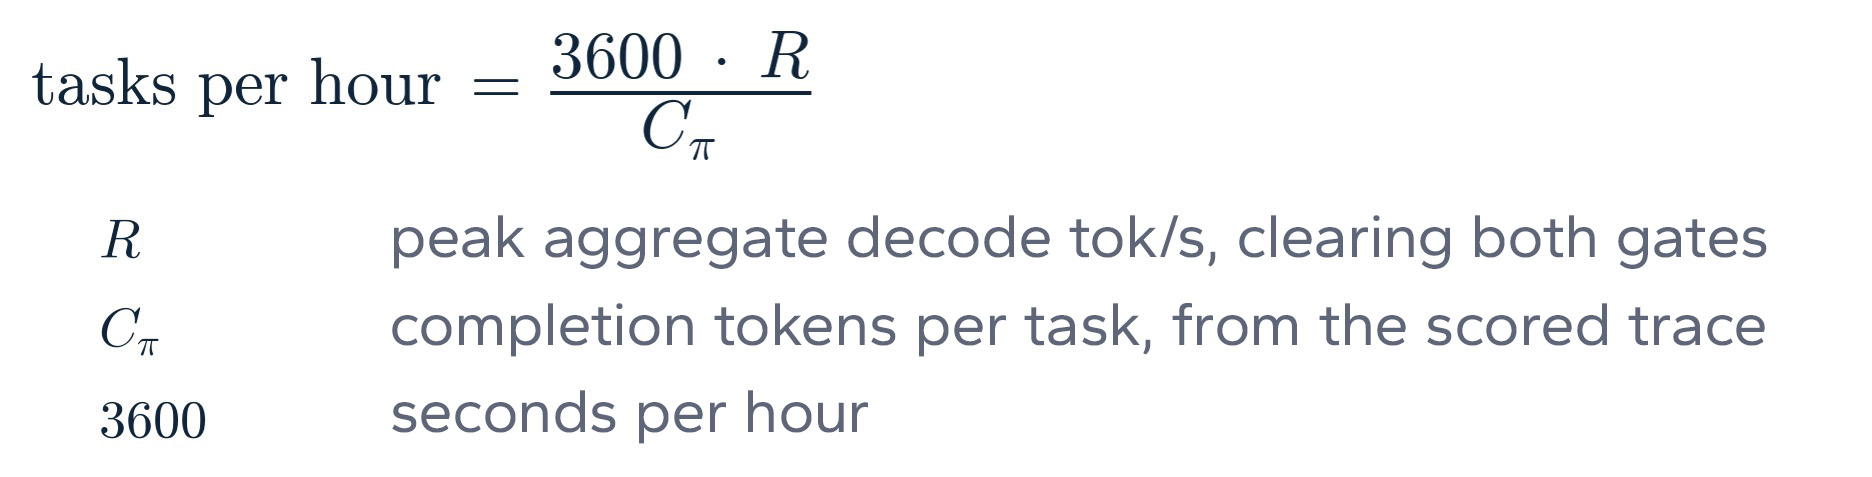
Every term is either measured or explicitly derived. R is measured on the reference platform under load. C is measured on the scored runs. The 3600 converts seconds to hours. Nothing in the chain is estimated and nothing is a duration.
This construction is also hard to game in the direction vendors are usually accused of gaming. A configuration tuned for throughput at the expense of answer quality still owes the quality term in the composite, and a configuration tuned for a single fast stream never reaches a competitive R because R is measured under load.
13.6 The measurement honesty check
The saturation instrument runs a single task, and the entire speed methodology depends on that task loading a model the way the scored suite does. That is an assumption, and it was tested rather than asserted. The result below includes the imperfect part.
The tokenizer carries the argument. A model uses the same content to token mapping in every instrument, so a saturation task that holds a fixed volume of content rather than a fixed token count loads each model to its own representative point automatically. A token efficient model legitimately sits lighter, which is a real efficiency to credit rather than an artifact to normalize away. The check is whether the saturation context lands where the scored workload actually lives, and it is run on models that appear in both instruments with the same tokenizer.
Figure 9: Saturation context against each model own scored p95 context. Measured. The median scored sample sits at 46K, so the saturation anchor is the loaded normal point rather than the average.
Both land within roughly 10% of the scored p95 for that model, on its own ruler. The cross-model relationship is directionally consistent as well, with the lighter tokenizer sitting at approximately 0.64 of the heavier one in the saturation instrument against 0.74 at scored p95.
A residual remains. Token accumulation across rounds depends on what the agent reads and how it proceeds, both of which vary run to run, so a small mismatch is inherent to measuring agentic work rather than a sign that something is wrong. The cross check covers two tokenizer families, which is a small sample for an assumption this load bearing.
13.7 Publishing the sweep
The full concurrency sweep is published rung by rung, including the levels that failed and which gate each one failed on. A capacity claim of the form this platform sustains N agents is only checkable if a reader can see the rung above N failing, and can see which of the two thresholds it failed.
This also disciplines the claim internally. Publishing the failing rung makes it impossible to quietly report a peak that was never sustainable, and it gives a vendor engineer something specific to argue with, which is a better outcome than a headline number they can only disagree with in general terms.
14. PINNACLE Intelligence Throughput
Quality and speed are reported independently and can be read that way. They are also combined into one figure, because a buyer comparing platforms eventually has to trade them off and pretending otherwise pushes the judgment onto the reader without giving them the tools to make it.
14.1 The composite
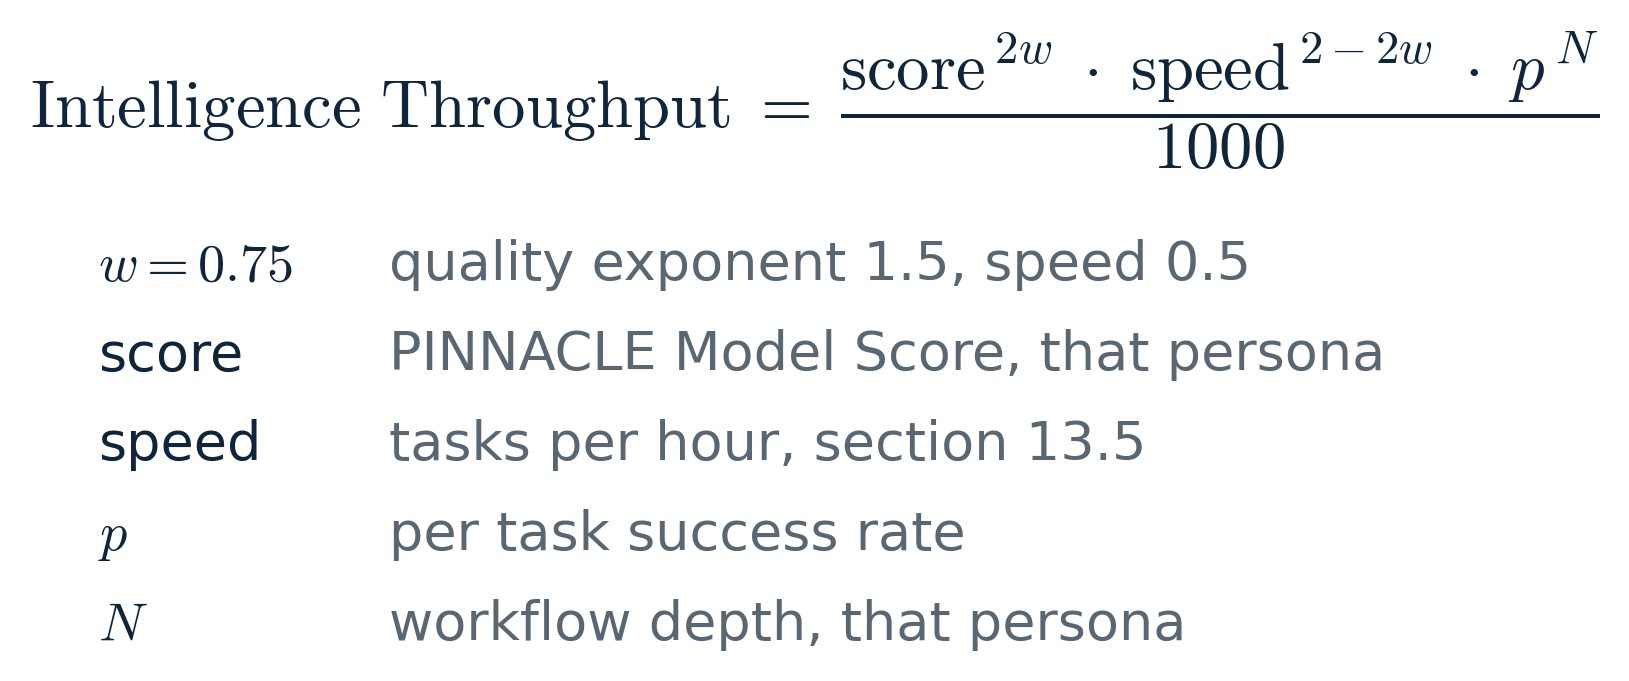
At w equal to 0.75 the speed term is a square root. Tripling the usable capacity of a platform raises Intelligence Throughput by a factor of roughly 1.73 rather than 3. That is the weighting doing its job. Scalability is rewarded and raw speed cannot buy quality cheaply.
14.2 The weighting is judgment, and it is owned
Three to one is an editorial judgment by Signal65. It is not derived from data and it is not the output of an optimization. It is stated as judgment everywhere it appears, it is the same weighting for every vendor and every result, and the reasoning behind it comes from advisory work rather than from the benchmark.
Three observations from that work point the same direction. Enterprises abandon agentic pilots over accuracy far more often than over latency, and a pilot that produces wrong output does not get a second round regardless of how fast it produced it. A wrong deliverable also costs more than a slow one, because someone has to find it, which means redoing the work that was delegated in the first place and absorbing whatever the error touched downstream. And latency has a floor below which additional speed stops being worth anything, since work handed to an agent is typically collected later rather than watched in real time, while accuracy has no such ceiling.
Weighting quality three times as heavily as speed reflects that asymmetry. It is a judgment about what enterprises are observed to do rather than a claim about what they should do, and a buyer whose economics differ can recompute the composite from the published inputs.
One weighting publishes, and it is the same one for every vendor and every result. Every input to the composite publishes alongside it, so a buyer whose economics differ can recompute it at whatever ratio their own experience supports.
14.3 Why per task success compounds
The p to the N term is what separates this composite from a throughput number with a quality adjustment bolted on. A workflow of depth N completes only if every step in it completes, so a per step success rate of 0.97 across a depth of five yields roughly 0.86 end to end, and a rate of 0.90 across the same depth yields roughly 0.59. Small differences in per step reliability become large differences in delivered work, and the deeper the workflow the more brutal the arithmetic gets.
This is the honest reason autonomy is hard. It is also why a model that is slightly less accurate and considerably faster does not automatically win, since the compounding term erodes faster than the speed term grows.
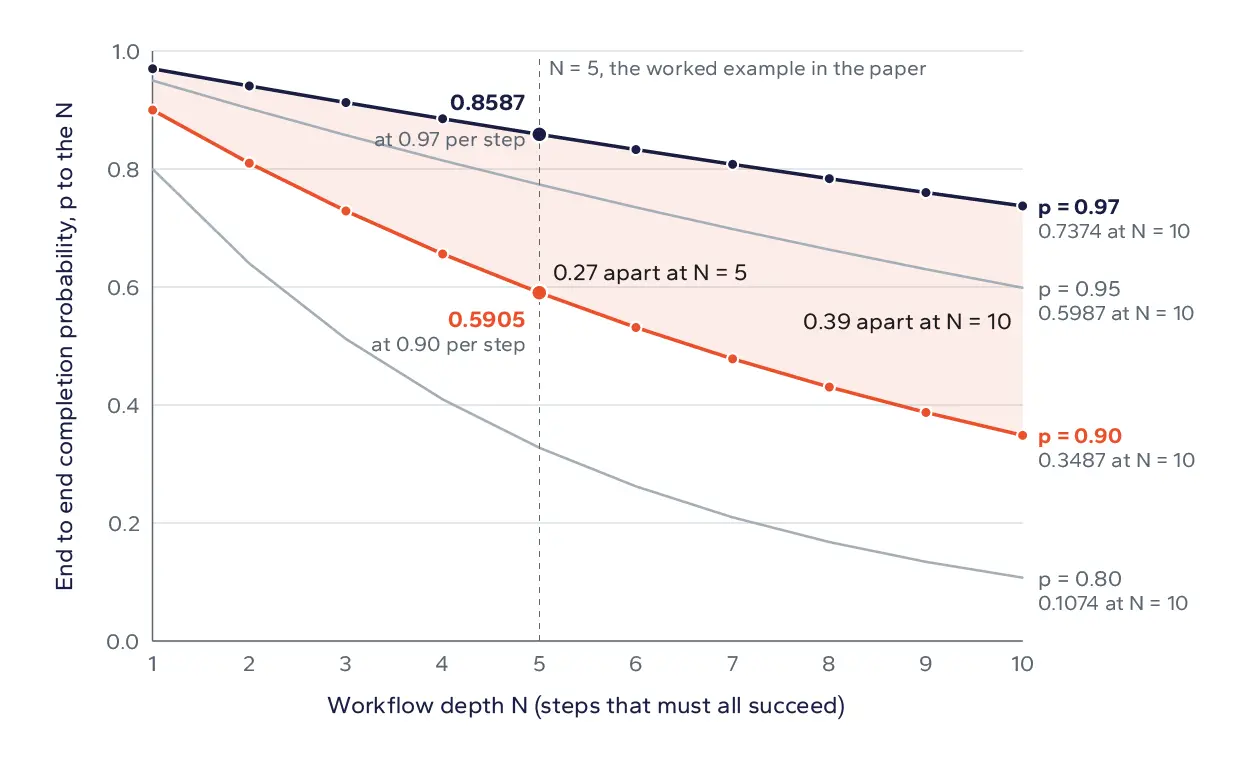
Small differences in per step reliability become large differences in delivered work. At depth five, 0.97 per step delivers 0.8587 end to end and 0.90 delivers 0.5905.
14.4 Break even failure cost
Alongside the composite, each model carries a break-even failure cost. It answers a single question. How expensive would one failure have to be before a cheaper, less accurate model stops being the better buy. A model with high accuracy and high token cost has a low break-even, meaning it pays off as soon as failures cost anything meaningful. A fast, cheap, less reliable model has a high break-even, meaning it only makes sense where failures are close to free.
Expressed that way, the number tells a reader something about their own tolerance for autonomy rather than something about the model in isolation, which is what makes it useful for a procurement conversation.
15. Precision and Quality Parity
Reduced precision buys throughput, and the question a buyer needs answered is what it costs in return. Signal65 PINNACLE measures the answer as well as the rate, on the same runs, which turns that question into something we can measure directly.
15.1 Why a cross precision throughput number is not a comparison
Reduced precision produces more tokens per second. That is the point of it. A comparison that reports tokens per second at one precision against tokens per second at another has measured two different workloads and presented the result as though it measured one, and the direction of the error always favors whichever side reduced precision further.
The comparison is only meaningful if the answers are equivalent. Establishing that requires a quality measurement taken on the same configuration, which is exactly what a throughput only benchmark cannot supply.
15.2 The quality parity gate
Matched precision is the published default on the leaderboard. A cross platform capacity comparison is reported at equivalent precision unless the paired quality runs demonstrate that the answers hold, and where a vendor recommends a reduced precision configuration for production, the quality run at that precision is published alongside the capacity number rather than assumed.
The practical shape of the gate is a paired run. The same model, the same scenarios, the same harness, at two precisions, scored the same way. If the scores are within measurement noise, the precision reduction is free and the throughput gain is real. If they are not, the throughput gain has been partly paid for in answer quality and the comparison has to say so.
15.3 Quantized models are separate entries
A quantization changes the weights, so a quantized model is not the same model as the one it was derived from and it is never merged with it. Every quantized configuration appears in published results as its own entry, with its precision in the model identifier.
Coverage here is deliberately narrow at launch. Signal65 has not systematically swept quantizations for every model, so where multiple precisions of one model exist in the results they exist because that pairing was worth testing, not because the roster is comprehensive on this axis.
15.4 Where reduced precision stops holding
Precision effects are not uniform across task length. Reduced precision configurations that hold quality on short tasks do not necessarily hold it on long context work, where small numerical differences accumulate across many rounds and many tokens of context. A parity check run only on short tasks can clear a configuration that will not hold in a deployment.
This is why the parity check runs on the same agentic and long context workloads as the rest of the suite rather than on a short proxy.
15.5 The serving stack is part of the configuration
Model scores in this suite do not change with the accelerator, and we know that because we tested for it. Scores were originally computed separately on each hardware platform. Across MI300X, H200, and B300 the differences in both component benchmarks sat inside run to run noise, so the practice was dropped and quality is now measured once per model. The reference platform for PINNACLE Speed is B300, which puts every model on the same box for its throughput terms. Multiple platforms enter the suite only in the silicon capacity lens, where throughput and sustained agent count are the quantities being compared.
The serving stack is a different matter, and it is the one configuration axis that has visibly moved answer quality in our testing. The mechanism is rarely intentional. Kernel bugs, version regressions, and misapplied optimization flags all surface the same way, as a configuration that runs fast and returns wrong output. Multi token prediction is the clearest example encountered so far, since it is supposed to leave outputs unchanged and simply arrive sooner. In practice, specific model and stack combinations have produced degraded scores and, in some cases, garbage tokens on a fraction of requests while the throughput number looked excellent.
This is why a quality check runs ahead of a capacity sweep rather than alongside it. A configuration that produces wrong output is not a fast configuration, it is a broken one, and no throughput figure derived from it is worth publishing. A vendor recommended flag that reduces answer quality is exactly the finding a buyer following that vendor cookbook needs to see.
Current results are overwhelmingly vLLM. A small number of models have been measured on SGLang as well, and those comparisons publish as a supplementary view rather than as a claim of broad cross stack coverage. Expanding that coverage across the roster is planned for subsequent releases, and until it lands, no result in this suite should be read as a general statement about how a model behaves on a stack it was not measured on.
Hardware support for numeric formats is the remaining axis. Platforms do not offer the same set, so a like for like comparison at a format only one platform supports is unavailable. Where that happens the comparison is reported at the highest format both platforms support, and the reduced precision result publishes separately with its own quality run attached.
15.6 What this means for a cost per token figure
A cost per token won at reduced precision is a cost per token for a different answer distribution. Where the parity check passes, the cost figure stands and the platform deserves the credit. Where it does not, the honest quantity is cost per correct task rather than cost per token, and the two can point in opposite directions.
16. Live Simulation and Gradability
There is a real and interesting comparison to be drawn between measuring recorded work and measuring generated work, and the two are often treated as competitors when they are better understood as instruments with different reach.
A recording carries something a generated scenario cannot, which is the actual shape of production traffic. A generated scenario carries something a recording cannot, which is a correct answer. Both are worth having. Only one of them supports a statement about whether the work came out right.
You cannot grade a recording. A trace contains what happened, not what should have happened.
16.1 What a live agentic session is
An agent receives a job, explores an environment it has not seen, chooses its own path, and produces a set of artifacts. It does not know how many rounds the job should take. It does not know which files matter. It does not know that a second copy of a record exists three directories away, or that the rule it needs sits in the fourth section of a handbook rather than the first.
What it does have is the freedom to be wrong in its own way, and that freedom is the measurement. A model that takes eighty rounds where another takes thirty, or that abandons a job partway, or that reconciles a contradiction incorrectly, has revealed something that no constrained replay would surface.
16.2 Why a recording cannot be graded
No ground truth was ever created for a recorded session. The data was whatever the data was, and no process wrote down the correct outcome before the work started. So there is no answer key inside the trace to check an output against.
This is why benchmarks built on recordings report throughput and cost and never report quality. It is not an oversight in those benchmarks and it is not a criticism of them. It is a property of the artifact they are built on. A replay can tell you exactly what a stack costs to serve a given shape of traffic, which is a genuinely useful thing to know.
16.3 Why measuring correct work requires generating it
The correct answer has to be created in the same moment as the environment. That is the only construction in which a deterministic grader has something to compare against, and it is the reason generation is a requirement rather than a convenience.
Three layers carry the argument.
Generation is the mechanism. Gradability is the point. The distinction that matters when comparing instruments is not whether a workload was recorded or generated, but whether the resulting measurement can be checked against a known correct outcome.
16.4 The consequence for capacity measurement
There is a second consequence that matters specifically for platform comparison. A model prevented from choosing its own path cannot show that it would have taken more rounds. A replay fixes the request schedule, so the traffic shape is identical regardless of which model is behind it, and the difference between an efficient model and a wasteful one disappears from the measurement entirely.
Under live execution that difference is preserved. A model that needs more rounds and more tokens to reach the same outcome consumes more of the platform, and the capacity number reflects it. That is the correct behavior, because it is what the platform will actually experience in production.
17. Reading the Results
The full result set publishes alongside this document. The three lenses below carry their own reading rules, with a small number of worked examples chosen to show the shape of an answer rather than to carry a headline.
17.1 Model intelligence
The model lens reports the PINNACLE Model Score, the five persona scores beneath it, token efficiency, and fabrication rate. It is hardware independent, which means it answers the first of the three sequential procurement questions and can be read before any infrastructure decision has been made.
The default presentation is a two axis view with quality on one axis and token efficiency on the other, because the two are independent and a single ranking hides the trade. A model can lead on quality and sit at the bottom on efficiency, and for a high volume deployment that combination is often the wrong buy. Persona selection re-ranks the table, which is where a leaderboard becomes an answer to a specific question rather than a general one.
17.2 Silicon capacity
The silicon lens reports what a platform sustains under load. Usable aggregate capacity at the gates, the concurrency at which it was reached, first token behavior at that rung, and the scaling and collapse profile across the sweep. Configuration is disclosed inline, including serving framework, precision, node shape, and software versions, because a capacity number without its configuration is not a measurement anyone can act on.
The example below shows the shape of a generational within vendor comparison across a model roster, which is the most straightforward reading the lens supports.
Figure 10: Generational capacity comparison within one accelerator vendor. Measured. Usable aggregate is decode tokens per second at the highest concurrency rung clearing both gates, and at N is that concurrency. Gains are derived as the ratio of the two measured aggregates.
Three things in that table drive the reading rules for this lens.
17.3 Solution economics
The solution lens reports cost per correct task and the utilization crossover between renting and owning. Hosted models are priced at their full API bill, which counts input tokens, cached input at the vendor's discounted cache-read rate, and output tokens, all at published list rates. Open models are priced as the share of a rented node-hour the work consumes, at a stated utilization. Both sides count every token the job consumed, and the tokens spent on failed attempts are billed to the tasks that finished, which is what makes the two directly comparable. Pricing hosted models on output tokens alone understates their cost per correct task several times over on agentic work, because the input an agent re-reads on every round dominates the hosted bill, and an earlier draft of the tooling made exactly that error before it was corrected.
The crossover is the point at which amortized owned infrastructure becomes cheaper than per token pricing for a given volume of correct work. It moves with model choice, with token efficiency, and with utilization, and it publishes as a curve so a reader can locate their own volume on it.
17.4 Configuration disclosure
Every published figure carries the configuration that produced it. Model identifier and precision, serving framework and version, node shape and accelerator count, context length, concurrency rung, and any tuning applied along with where that tuning came from. This appears with the result rather than in an appendix, because a reader evaluating a number should not have to leave the number to find out what it means.
18. Governance
Benchmark results are only as useful as the process that produced them, and a reader deserves to know that process before they are asked to rely on a number. Signal65 publishes its governance rules in advance for that reason, so that anyone can see how results are produced, refreshed, corrected, and disclosed, and can hold the published record against the stated rules.
Vendor involvement is part of that process rather than something worked around. Vendors know their platforms better than any outside party does, they are frequently the first to spot a misconfiguration, and results are stronger when they have had the opportunity to check the facts. The rules below set out where that involvement helps and where the line sits. The full document publishes alongside this paper.
Figure 11: What the governance document covers.
Two of these carry more weight than the rest. The vendor review window exists because factual errors are worth catching before publication and vendors are frequently the party who can catch them. It carries no approval right, and a vendor disagreement about a result that is factually correct does not delay or alter publication. Funding disclosure is stated per result rather than as a policy line, because a blanket statement that Signal65 works with vendors tells a reader nothing about the specific number in front of them.
Underneath the rules sits the structural point. Scoring is deterministic and the methodology is published, so a result cannot be argued into a better number and any party with the hardware can reproduce it. Rules matter, and rules that rest on a reproducible measurement matter considerably more.
7.1 Anatomy of a scenario
A scenario is not a question. It is a working session with four components.
7.2 Round and context profile
Scenarios run against a 100 round cap and accumulate substantial context as they go. Each round appends the prior exchange plus whatever the agent read, so a session that begins with a short instruction is operating over tens of thousands of tokens of accumulated state by the time it produces its final deliverable. This is what makes the workload agentic in the sense that matters for infrastructure. Context grows monotonically, prefix reuse is high, and the tail of the session is where both quality and serving behavior are decided.
7.3 One job, end to end
The specifics below are illustrative of a scenario shape rather than a transcript of a particular run.
7.4 The calibration loop
A scenario enters the suite only after it has survived a calibration pass in which traces are read rather than scores tallied. The pass asks one question about every failure. Did the model fail the job, or did the job fail the model. Calibration has caught cases of the second kind, where a strong model reached a defensible reading of a rule that the answer key did not encode. The correct response in that case is to rewrite the rule so that it admits one interpretation, not to adjust the key.
19. Limitations and What We Do Not Claim
Every item below is something a determined critic would otherwise find on their own.
19.1 On coverage and grounding
19.2 On scoring
19.3 On performance
19.4 On independence
Signal65 is an independent research and analysis firm, and independence in this business is demonstrated rather than asserted. Ours rests on four things a reader can check directly.
Signal65 works commercially with technology vendors, including vendors whose products appear in these results, and that funding relationship is disclosed per result rather than as a blanket statement. Reproducibility is what makes the disclosure meaningful.
20. Roadmap
The suite described in this paper is the first release rather than the finished instrument, and the work below is where it goes next. Several of these are already underway and all of them are open to input from the partners reading this document, which is a large part of why the roadmap is published at all. Nothing here carries a date and nothing here ships at launch.
20.1 A sub-agent environment
A third environment, governed but much shorter, where a scenario is one or two steps rather than a full workflow. A large share of real deployments are built this way, with an orchestrator decomposing work and calling narrow agents to execute pieces of it, and the current suite does not measure that shape directly.
20.2 Broader coverage
More of the testable set exercised directly rather than through accompanying work products, a broader model roster, and coverage of new models closer to their release date.
20.3 Decomposed workflows
Measuring an orchestrator routing work to smaller models running narrow subtasks, which is a materially different economic proposition from running one large model end to end and is not comparable to it under the current scoring.
20.4 Solution and cluster validation
Validation across the full stack rather than a single node, including the difference between first light and steady state, which is where a meaningful share of deployed capacity is actually lost.
20.5 Cross stack coverage
Systematic measurement of the same models across serving frameworks, so that the effect of the stack on both throughput and answer quality becomes a published axis rather than a supplementary view. Early results already show that the choice of inference stack changes both, and the second of those is the one buyers do not expect.
20.6 Energy
Performance per watt from measured device power rather than from thermal design power, which assumes full utilization and describes a cooling envelope rather than a workload. The instrumentation exists on both major accelerator families and the work is scoped rather than scheduled.
20.7 Distributed and CPU side measurement
Multi node and split inference shapes, and a companion instrument that isolates the CPU contribution to agentic performance. Early proof of concept work shows that the ranking between two CPUs can invert as agent concurrency rises, with peak single thread performance winning while cores are idle and core count and memory headroom deciding once every core is busy. That is a sensitivity curve rather than a single score, and it is the correct shape for the question.
21. What This Benchmark Is For
An enterprise evaluating agentic AI is not buying a model. It is buying an outcome produced repeatedly, correctly, and at a cost it can forecast. That is a more specific question than the one the field usually asks, and it is the question this suite was built to answer.
That focus is what makes the numbers usable. Because the scope is fixed and stated, every number here is checkable. Scoring is code against a generated answer key before the agent started. Environments regenerate, so nothing static exists to memorize. Configuration travels with every published result. Any party with the hardware can reproduce the measurement and disagree with it specifically rather than in general terms.
What comes out of that is a set of numbers a buyer can act on. Whether a model finishes the job on data as they actually hold it. How far it falls when the data is not clean. How often it invents an answer that was never there. How many agents a platform sustains while all of them stay useful. What one correct outcome costs, and at what volume owning the infrastructure beats renting it.
Those answers will sometimes disagree with the general capability leaderboards, and the disagreement is informative rather than embarrassing. A model that finishes enterprise work reliably at a fraction of the token cost is the better buy for that work even when a larger model reasons more impressively about everything else. Signal65 PINNACLE exists to make that case in numbers rather than in argument.
Important Information About this Report
CONTRIBUTORS
Ryan Shrout
President and GM | Signal65
JV Roig
Senior Generative AI Platform Engineer | Kamiwaza
PUBLISHER
Ryan Shrout
President and GM | Signal65
INQUIRIES
Contact us if you would like to discuss this document and Signal65 will respond promptly.
CITATIONS
This paper can be cited by accredited press and analysts, but must be cited in-context, displaying author name, author title, and Signal65. Non-press and non-analysts must receive prior written permission by Signal65 for any citations.
LICENSING
This document, including any supporting materials, is owned by Signal65. This publication may not be reproduced, distributed, or shared in any form without the prior written permission of Signal65.
DISCLOSURES
Signal65 provides research, analysis, advising, and consulting to many high-tech companies, including those mentioned in this paper. No employees at the firm hold any equity positions with any companies cited in this document. Funding status is disclosed per published result under the governance rules described in chapter 18.
ABOUT SIGNAL65
Signal65 is an independent research, analysis, and advisory firm, focused on digital innovation and market-disrupting technologies and trends. Every day our analysts, researchers, and advisors help business leaders from around the world anticipate tectonic shifts in their industries and leverage disruptive innovation to either gain or maintain a competitive advantage in their markets.
For more information, visit signal65.com
or contact research@signal65.com